
mRNA vaccine picture courtesy of Wikipedia
This scientific, engineering and logistical achievement that is the COVID-19 vaccine is a feat unparalleled. It’s the perfect example of human ingenuity and how modern advancements can make a difference. A lot of credit, however, has to go to the rise of Industry 4.0 and the use of digital technologies like automation, computer science, and advanced analytics. In fact, automated operations, process simulation, and self-service analytics have helped pharmaceutical production processes become more agile and efficient, contributing to increased production capacity and product quality. This solution has become the production and quality control game-changer by making pharmaceutical companies more adaptive and responsive, thus improving operational processes.
Using time-series data to improve operational performance
Captured from sensors throughout the production line, time-series data can help improve operational performance and control product quality. In addition, with self-service analytics, crucial quality information for each vaccine batch can be attained, assessed and tracked for quality control purposes.
Process experts can monitor production to prevent quality problems by using systematic measurement, comparing known standards, keeping track of production variables, and linking the associated feedback loops. Key variables such as temperature, pH, and cycle time should also be monitored because they can affect quality. Therefore, monitoring these variables along with sensor-generated time-series data is crucial to quality control.
Equipment health, product storage and shipment conditions, packaging, and handling are other key factors that could impact product quality. Moreover, additional complexities come into play because each of these factors can differ for each vaccine. With the help of self-service analytics, all of these factors can be more easily monitored.
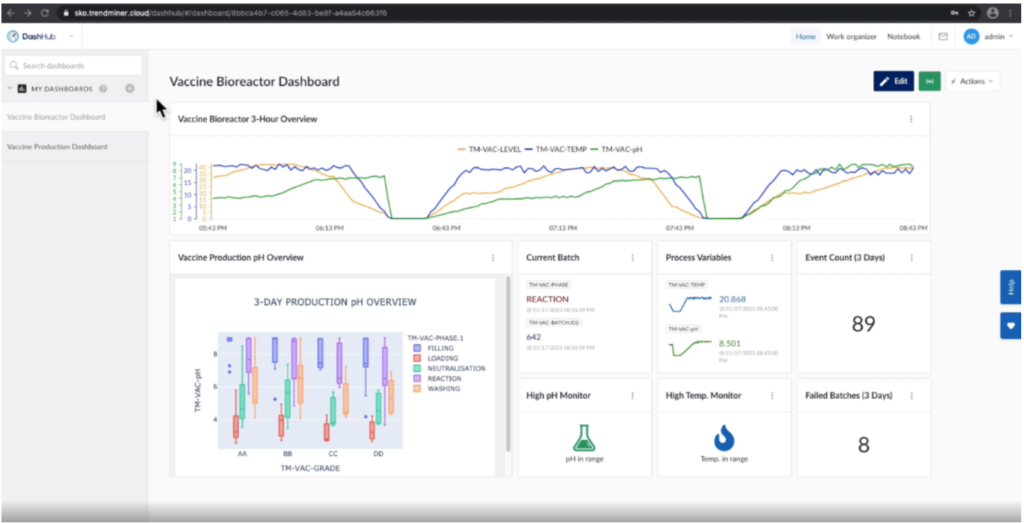
Figure 1. Vaccine Bioreactor Dashboard showing statuses of key variables and production overviews. Image courtesy of TrendMiner.
Advanced analytics: The next stage in your SME’s analytics maturity
Data scientists have been using sensor-generated time-series data to create process monitoring and prediction models to resolve complicated process challenges. This time-consuming, analytically demanding effort requires experts in the field to overcome vital production-related issues. However, besides data scientists, process experts have been doing their kind of process analytics. This type of analytics includes importing data from sensors, aggregating contextual information from other sources, and filtering out irrelevant periods. It also can involve performing mathematical manipulations as well as calculating correlations.
With self-service analytics, subject matter experts (SME’s) can grow their analytics maturity and do more analytics heavy-lifting, addressing day-to-day process issues that the data scientists have no time to solve. With this tool and their process knowledge, these experts can rapidly interpret and use their plants’ time-series data to uncover meaningful information regarding production processes. Data can be easily visualized, and patterns easily recognized. In addition, the machine learning capability of self-service analytics enables users to quickly troubleshoot problems and optimize operations.
Eliminate data silos through the contextualization of production data
Besides allowing process experts to monitor and analyze their processes, self-service analytics lets SMEs contextualize production data. This information includes maintenance stops, process anomalies, asset health information, external events, production losses, and more and is fundamental to providing an accurate overview of the process. By keeping track of this crucial information, process experts can more easily assess production and keep track of quality control. Furthermore, this context information enables process experts to identify the best runs so that they can create a “golden batch fingerprint,” i.e., a benchmark for future batches. Self-service analytics also collects the data of underperforming batches, which can serve as a starting point for investigative analysis as described in the following use case.
Case in point – solving vaccine quality issues
While COVID-19 vaccine production was underway at a pharmaceutical plant, a team of process experts recognized an issue with the vaccine’s quality. To deal with this event, it was evident that they needed to drill down into the data as quickly and effectively as possible. They used a self-service analytics tool that delivered many capabilities to view all details of the production and other relevant process information. The analytics tool guided them through the vital steps within their investigative phases to fully understand what factors were affecting the batches. They then understood what was needed to resolve the vaccine quality issues.
The Investigative phases they conducted are as follows.
Phase 1: Issue Assessment
The team first ran a query to check out the batch data trends on their custom production dashboard, which revealed that the cycle time of a recent batch was much longer than normal. By reviewing the box-plot tiles within their dashboard, they determined that some of the process phases had a higher variation than others. Certain tiles within the dashboard served as visual references for meaningful data points delivered by the analytics.
Next, they checked the “current value” tiles and determined their process had been behaving within the expected control parameters. They then drilled down into tile data that contained contextual process information to determine the root cause for any inconsistency in quality. Their main focus was to investigate the “Failed Batch” events.
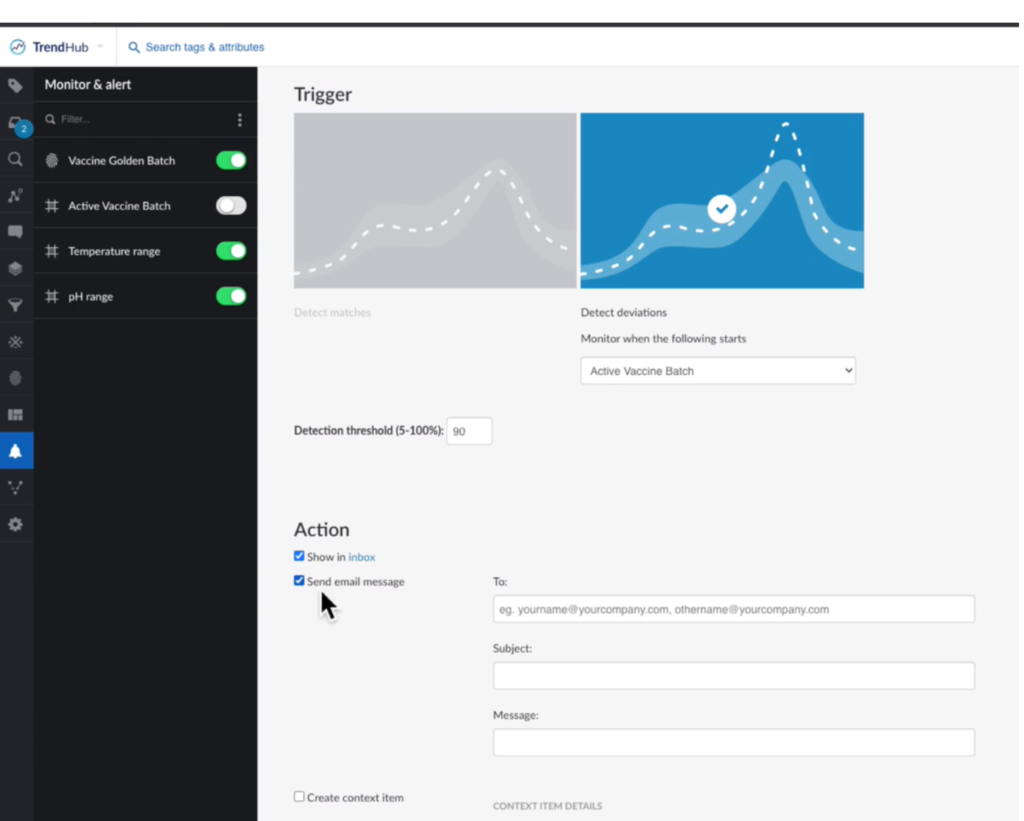
Figure 2. Failed batch event details. Image courtesy of TrendMiner.
Phase 2: Root Cause Analysis
The process experts’ next step was to assess the “Failed Batch” events to determine the cause of a lower quality batch. The team began by looking at the pH. They utilized the “Recommendation Engine” of the self-service analytics tool to suggest possible root causes. By comparing the failed batches against successful batches (“golden fingerprints”), they pinpointed the process deviated. They discovered that the cause of the bad batches was a drop in temperature that consequently caused a drop in pH.

Figure 3. Bad batch vs. vaccine golden batch. The shaded hull regions are from a fingerprint that was produced using the golden batches. The solid red, blue and orange lines represent the bad batches that clearly drift outside the hull regions established by the golden fingerprint. Image courtesy of TrendMiner.
Phase 3: Proactive Measures
To keep batches within the ideal thresholds, the team set a monitor that could work in conjunction with the golden batch fingerprint. If deviations from this golden fingerprint are detected, the analytics tool automatically sends out an email alert to personnel about potential problems. This allows the team to take proactive measures early during batch production to prevent bad batches.
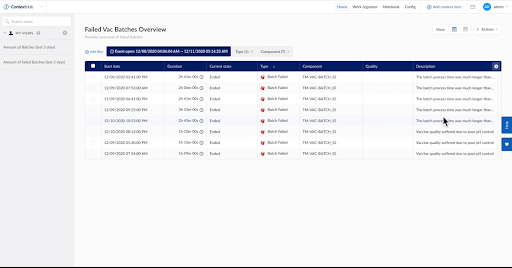
Figure 4. Monitor vaccine quality. Image courtesy of TrendMiner.
Conclusion
IIoT-enabled technology delivers unprecedented deeper insights into operations. Thanks to self-service advanced analytics, COVID-19 vaccine production and other lifesaving medicines can benefit from data-driven quality control and optimized production processes. This results in reduced production losses and costly setbacks. Vaccine production could never be moving as fast as it is now without the help of self-service analytics.
References

Michael Chang
Michael Chang jumpstarted his career in chemical manufacturing, with over 6 years of experience in operations, technology, process improvement, and EHS compliance. Having always been passionate about leveraging data to improve yield and troubleshoot manufacturing processes, he continues to drive improvements for the process industry as a Data Analytics Engineer at TrendMiner (www.trendminer.com).