
[Photo by Fusion Medical Animation on Unsplash]
COVID-19 has brought a newly heightened awareness of the need to better understand clinical trial statistics and their direct impact on the public. I cannot remember when statistical data was more in the limelight than now. The pandemic’s first wave put many countries into lockdown. All governments and their local representatives delivered press conferences regularly to update the masses on the newest statistics and safety precautions. There were statistics on how many people caught the disease, how many deaths, how many ICU beds were still available, and just about every interesting statistic you could think of related to the pandemic.
Data collected from the COVID-19 pandemic continues to be used to inform decisions and make future projections related to drug development and beyond. Individuals are also using pandemic statistics to decide how to live their lives, further highlighting this information’s importance. But the data has been getting more and more complex — from determining what underlying conditions are most at risk to examining differences across ethnicities or identifying regional variations. We have also been presented with results from clinical trials, both for treatments of COVID-19 and, most recently, COVID-19 vaccines.
With any new disease, efforts to tackle its spread evolve and in an ever-changing environment, even the simplest of questions become difficult to answer. The first question that one might ask when thinking about the COVID-19 pandemic is: “How many cases are there?” and while this question seems, on the surface, like it should be relatively straightforward to answer, it is more complicated than you think.
Breaking down the statistics
Let’s look at the reported number of cases in the U.K., published by the U.K. government daily, as seen in Figure 1. One would hope that this data serves as a good proxy for the underlying prevalence in the overall U.K. population.
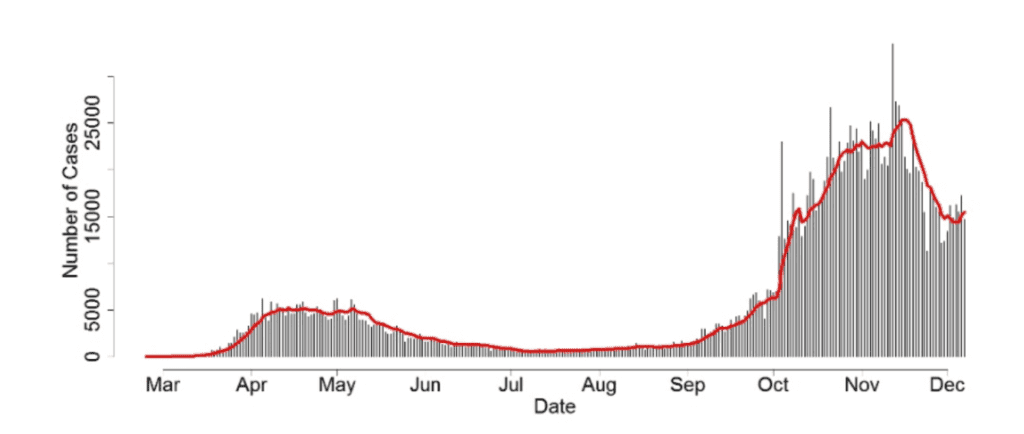
Figure 1: Number of individuals who have had at least one lab-confirmed positive COVID-19 test result, by date reported, 24th February – 7th December 2020. Source: https://coronavirus.data.gov.uk/cases
We know that testing only picks up a small percentage of all COVID-19 cases, but ideally, this daily reported number of cases would provide us with an accurate representation of the shape of the true prevalence of the virus across the whole U.K. Unfortunately, this is unlikely to be the case and using these reported case numbers to infer U.K.-wide prevalence is a difficult task. One critical complexity is that the number of people being tested for COVID-19 has changed throughout the pandemic. So, can we update our prevalence estimates to accommodate different testing numbers? Prevalence is defined as the number of positive cases in the population divided by its size. Under some heavy assumptions, we can estimate prevalence by considering the number of positive tests divided by the number of tests carried out. This assumes the following:
- Tests are 100% accurate.
- Random population samples are tested.
The first assumption is unlikely to be true, but the hope is that testing is sufficiently accurate that this would not be too much of an issue. However, the second assumption doesn’t hold for COVID-19 as those tested are typically individuals who think they may have the virus, either because they are presenting with symptoms or because they have come into direct contact with someone who has tested positive. Nevertheless, we can use this relationship between test numbers and test positivity to indicate just how different the shape of the actual prevalence curve would compare to the reported case data that we see.
Figure 2 shows a hypothetical prevalence per 1,000,000 people in the U.K., estimated by considering the number of positive tests divided by the number of tests.
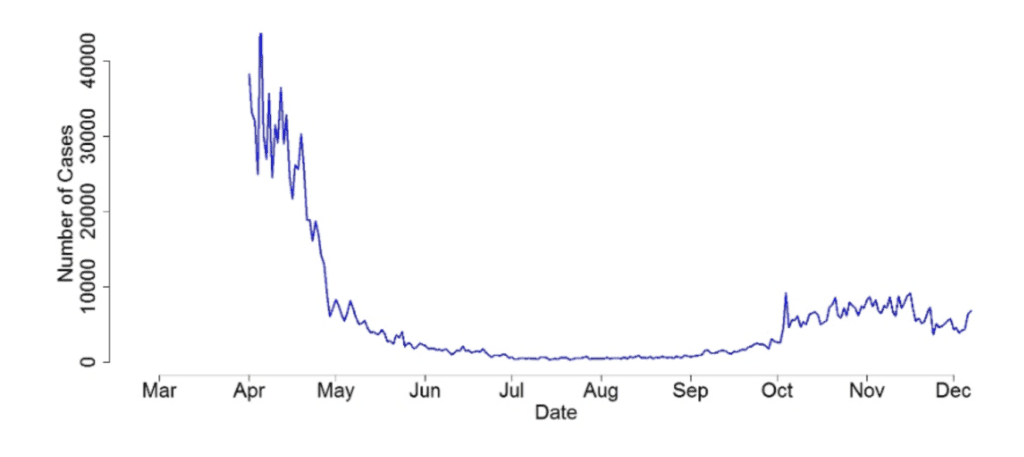
Figure 2: Estimated COVID prevalence (number of cases per 1,000,000 of the population) in the U.K.
To reiterate, I’m aware that this plot has been produced under unrealistic assumptions and is unlikely to be 100% accurate. However, it provides useful insight to show just how much of a difference there could be between the shape of the reported case curves published by the government and the real underlying prevalence in the general population. Specifically, it is interesting to note that the second wave’s underlying prevalence is likely to be much smaller than the prevalence during the first wave, despite the reported case numbers being much higher now than what was reported in March and April. This casts doubt on the relevance of the reported daily case numbers announced in the media like some “number theater.” I think it’s positive to see the government trying to be transparent and engaging the general public with data-driven decision making. Still, it is just as important to thoroughly highlight the strengths and limitations of this rapidly evolving, messy data to ensure clarity in disseminating information.
COVID-19 and the long-term the role of statistics
COVID-19 has provided the statistical community with a unique opportunity to showcase the vital role that statistics can play in society. Analysis of COVID-19 data has — and will continue to be — critical in the fight against the virus. But good statistics don’t just appear. One silver lining of the COVID-19 pandemic is that the general public has a greater appreciation of the value of statistics and understands the work carried out by statisticians to turn numbers into meaningful insight and useful narratives. It is now commonplace to hear people talking about the newest COVID-19 statistics, relying on those statistics to make informed, data-driven decisions. Hopefully, this newfound reliance on statistics will turn into a long-lasting legacy. Now, that would be a positive outcome from this terrible pandemic.
Jennifer Rogers is vice president for statistical research and consultancy at Phastar.